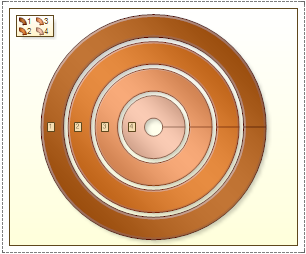
The Doughnut chart is circular chart divided into sectors. It has a blank center and the ability to support multiple statistics as one. Doughnut illustrates proportion. On the picture below the doughnut chart sample is represented:
|
<< Click to Display Table of Contents >> Navigation: Report Internals > Charts > Area > Doughnut |
The Doughnut chart is circular chart divided into sectors. It has a blank center and the ability to support multiple statistics as one. Doughnut illustrates proportion. On the picture below the doughnut chart sample is represented: