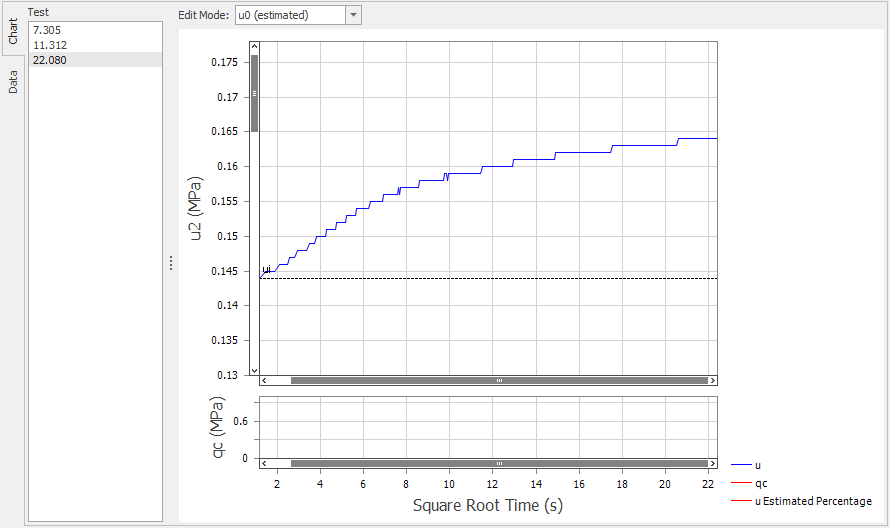
Dissipation test data can be viewed in charts of value vs square root time. Test selection can be changed using test navigator to the left of the chart.
Assessments
Both normal and complex assessments of dissipation data can be completed.
Normal |
Complex |
|
|
 How To: Assess a normal dissipation test
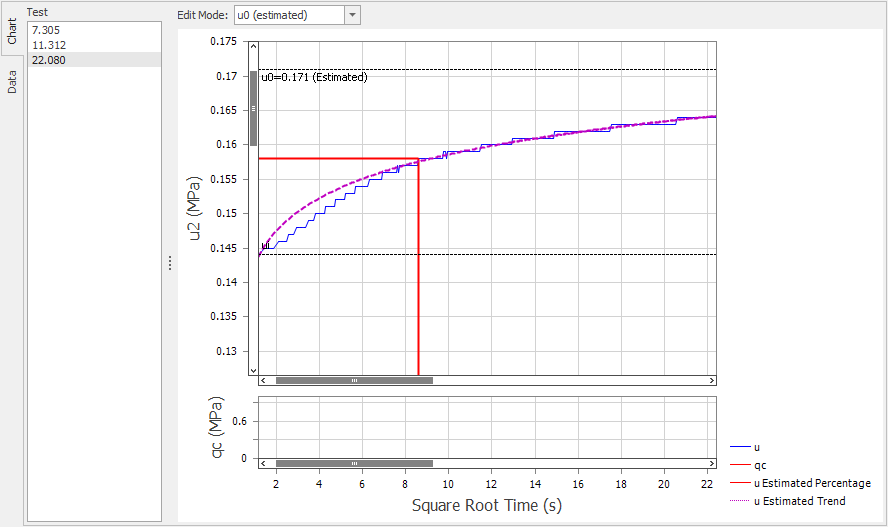
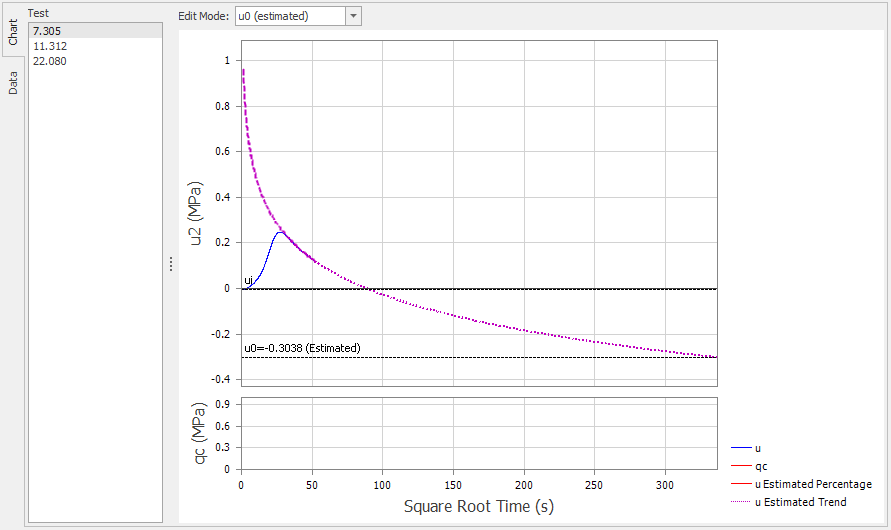
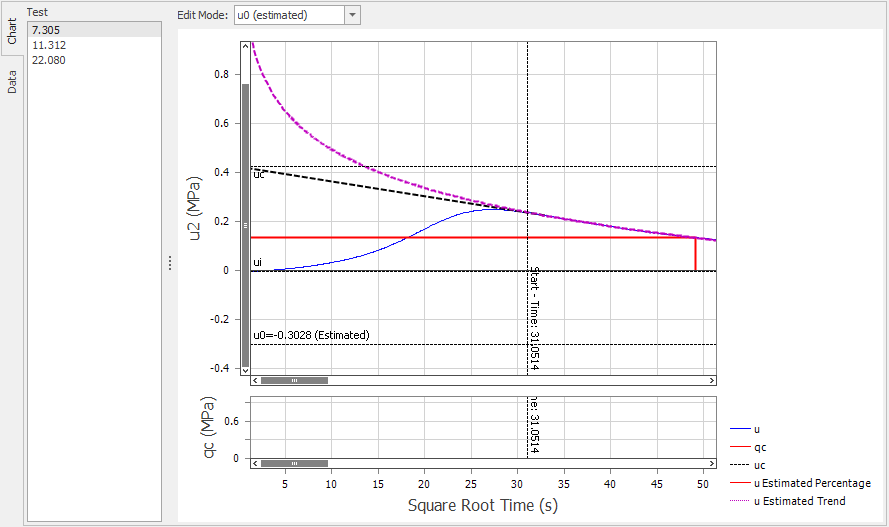
u0 is estimated based on extrapolation of the curve until an accepted tolerance is achieved. T50 (default) is assessed based on the ui and u0 values. |
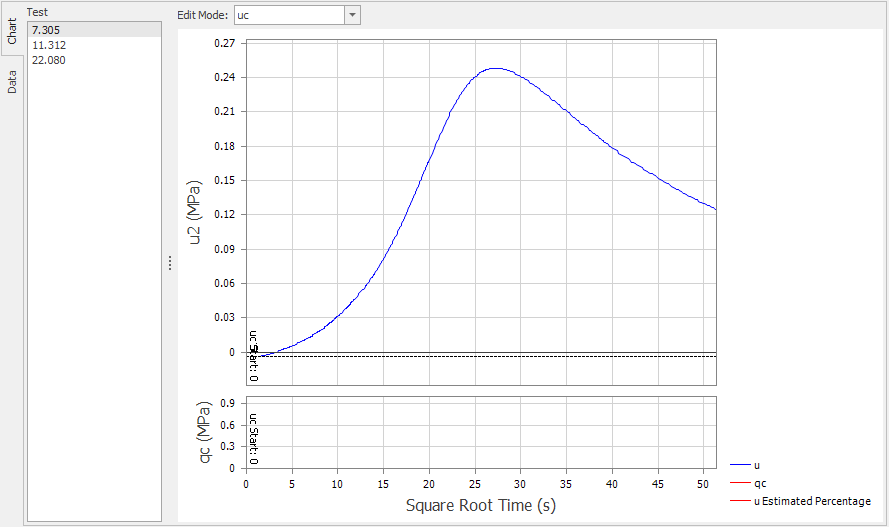
How To: Assess a complex dissipation test
A curve will be fitted to data to the right of the start time, and u0 estimated based on extrapolation of the curve.
A point that more accurately represents the initial pressure (uc) will be added. T50 (default) is assessed based on the uc and u0 values. |
|
Assessment is limited to estimating the u0 value and T- values (default T50 changed in the data grid). T-values can only be assessed from the actual data line (blue), not from the extrapolated curve fit. |