The Data Grid provide many advanced features that users can use to visualize data in different ways for each table:
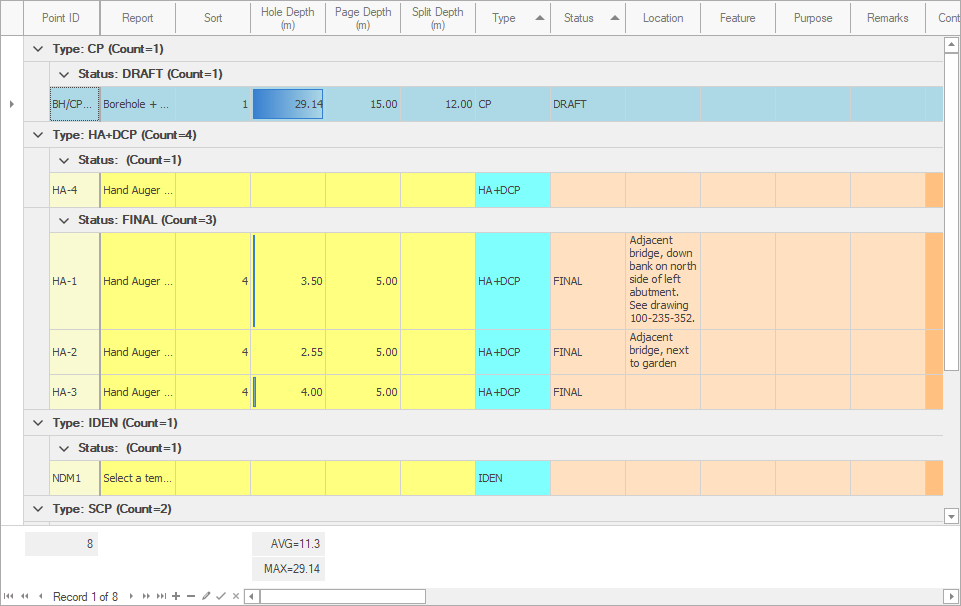
Including:
•Column width
•Column order
•Column visibility
•Column sorting
•Row groups
•Row height
•Row filters
•Conditional formatting
•Summaries
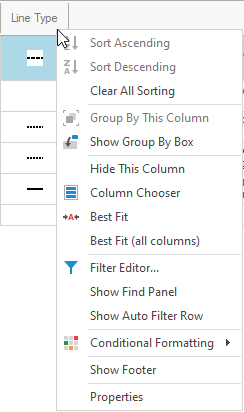
Most options are available through the column contextual menu shown by right-clicking the column header:
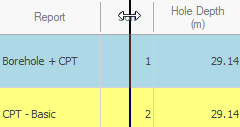
How To: Change column width
![]() Click on the column separator with the left mouse button, then drag the separator left or right:
Click on the column separator with the left mouse button, then drag the separator left or right:
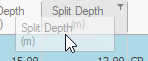
![]() Release the left mouse button once the desired width is reached.
Release the left mouse button once the desired width is reached.
How To: Sort columns
![]() Click on the column header with the left mouse button:
Click on the column header with the left mouse button:

|
Sort can be applied to multiple columns by holding down the SHIFT key. |
|
Sort cannot be changed when Continuous Range mode is enabled. |
How To: Hide columns
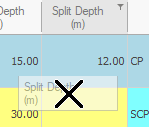
![]() Click on the column header with the left mouse button, then drag the header down onto the grid:
Click on the column header with the left mouse button, then drag the header down onto the grid:
![]() When an X appears, release the left mouse button:
When an X appears, release the left mouse button:
How To: Unhide columns
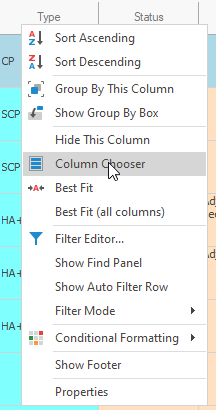
![]() Right-click on the column header to show the contextual menu, then click Column Chooser:
Right-click on the column header to show the contextual menu, then click Column Chooser:
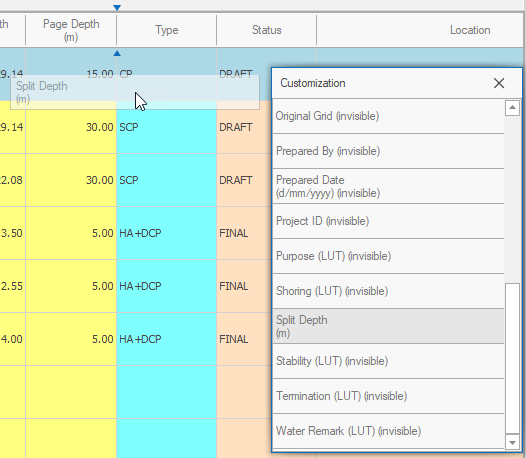
![]() Left-click on the required column and drag it to the column header, using the indicators to determine the position before releasing the mouse button:
Left-click on the required column and drag it to the column header, using the indicators to determine the position before releasing the mouse button:
How To: Move columns
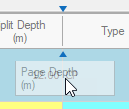
![]() Click on a column header with the left mouse button, the begin to drag the header left or right:
Click on a column header with the left mouse button, the begin to drag the header left or right:
![]() Use the indicators to determine the position before releasing the mouse button:
Use the indicators to determine the position before releasing the mouse button:
How To: Filter columns
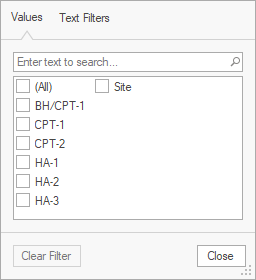
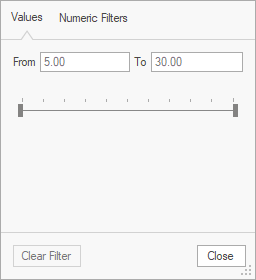
![]() Click on filter glyph on the column header to show the filter options for the current column:
Click on filter glyph on the column header to show the filter options for the current column:
![]()
Text |
Numeric |
Date / Time |
|
|
|
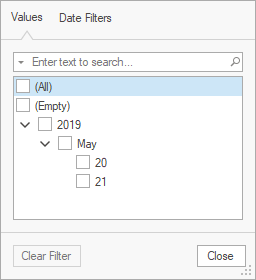
![]() Filters are automatically applied.
Filters are automatically applied.