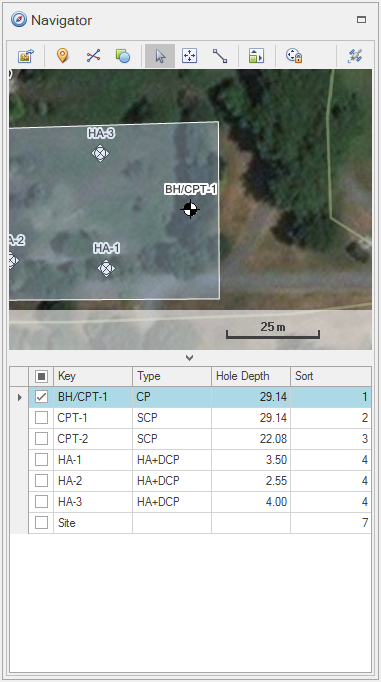
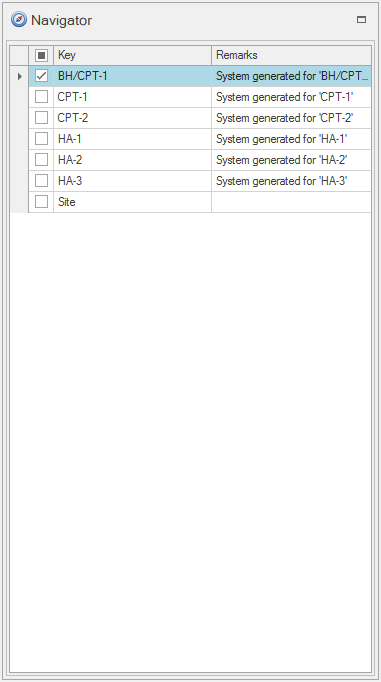
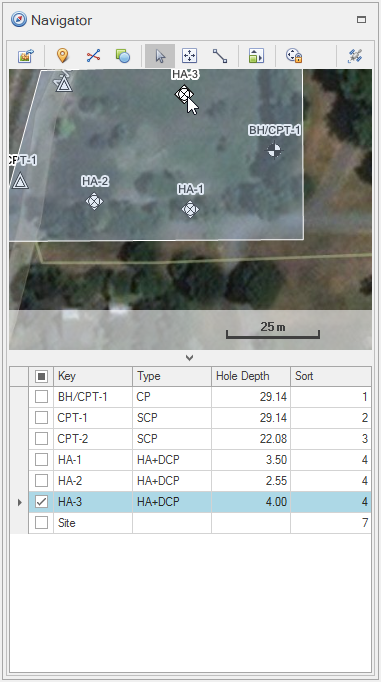
The Record Navigator provides multiple capabilities, including record selection / filtering and feature mapping. It consists of a grid control and a feature map shown on feature related tables:
Feature Related |
Non-Feature Related |
|
|
Navigation / Selection
One or more items can be selected in the Record Navigator, but only one item can ever be the focused item (always one of the selected items) that controls what data is shown in the data grid.
Selection of multiple items is typically only used in the generation of reports.
 Single Item Selection
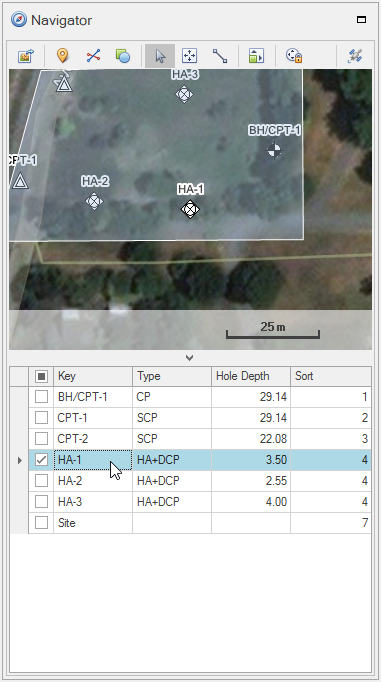
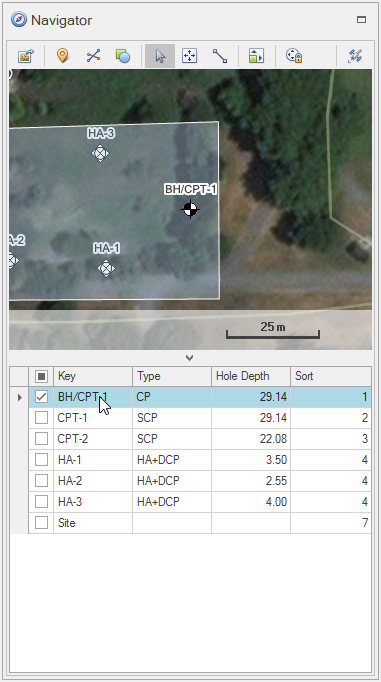
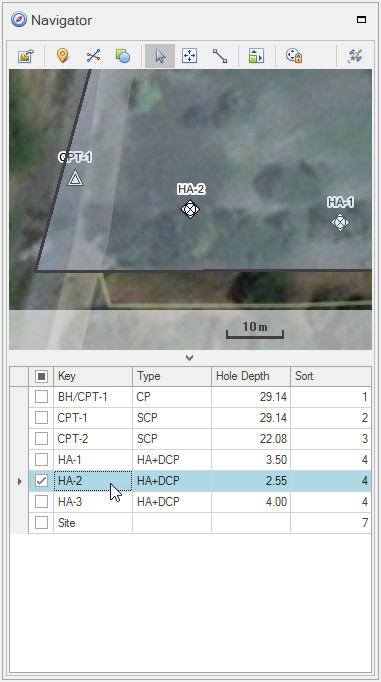
Single item selection is most commonly associated to data entry, with the focused row defining the data shown in the data grid. Changing the focused row in the grid control, changes the focused item in the feature map, and data shown in the data grid:
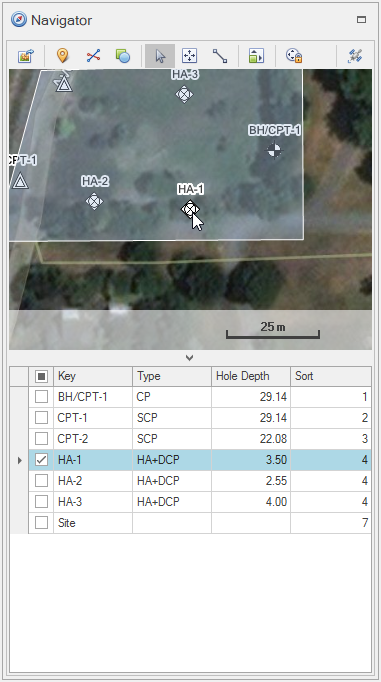
Changing the focused item in the map control, changes the focused row in the grid control, and data shown in the data grid:
|
 Multiple Item Selection
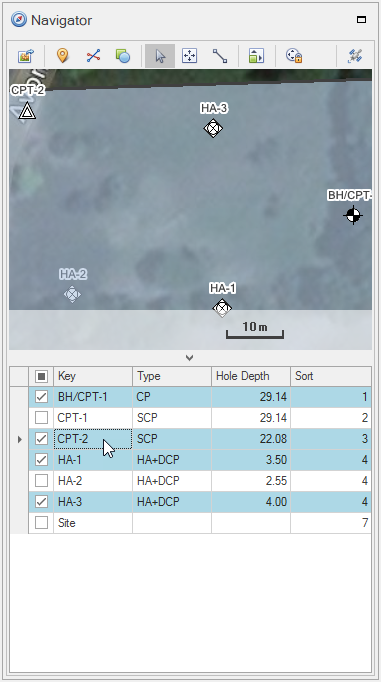
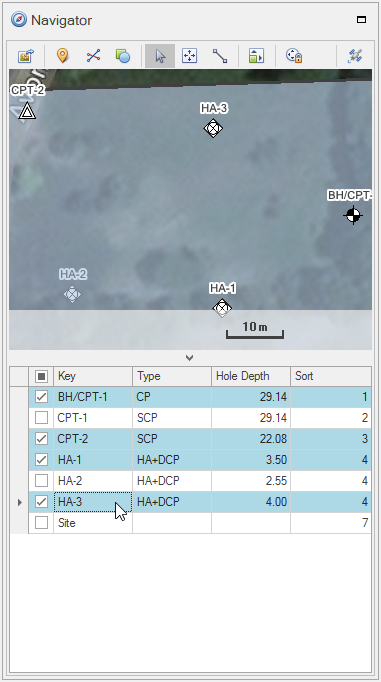
Multiple item selection allows for report generation from the Data Module. While multiple items can be selected, only the focused row affects the data visible in the data grid. When multiple items are selected, changing the focused row to another row in the current selection only changes the focused row, leaving the selection unchanged:
When multiple items are selected, changing the focused row to a row that is not in the current selection, will reset the selection:
|
Feature Mapping
The map control represents point, line (aka path) and area (aka polygon) features above any number of image layers utilizing web services such as Bing Maps.
When using CORE-GS in the field, the map control can indicate your current location to assist with positioning.
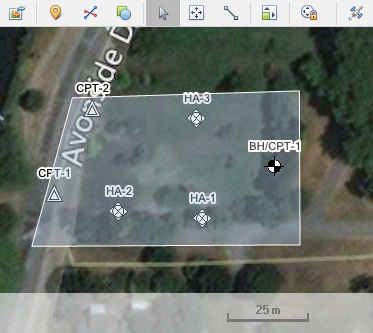
Users can create new features using the map control, then add data to any table related to the feature.
These features can also be edited after creation:
•Points - the position can be changed, automatically updating values in any of the coordinate systems that are assigned. Changing the type will change the graphic used to represent the point.
•Lines - vertices can be added, deleted and moved, and the line weight and line color changed.
•Areas - vertices can be added, deleted and moved, and the line weight and line color changed.
Features can be deleted through the map control by selecting items, then pressing the DELETE key.
|
Deleting a feature will remove all associated data. |
